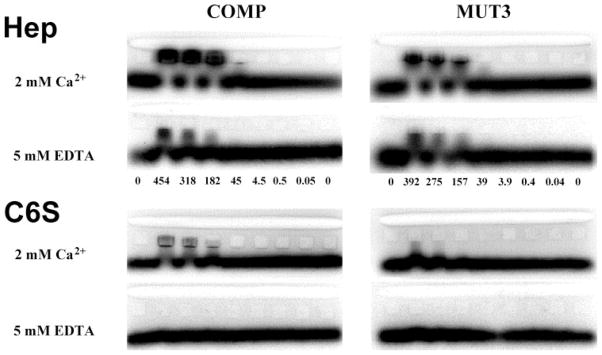
FIGURE 4. Affinity co-electrophoresis of COMP/TSP5 with heparin and chondroitin 6-sulfate.
ACE was carried out as described under supplemental data. Proteins were in solutions containing 2 mM CaCl2, or 5 mM EDTA as indicated in the figure. Concentrations of COMP/TSP5 or MUT3 embedded in each lane are indicated between the gels in nM. Radiolabeled heparin or C6S was loaded into the slot lane at the top of the gel. Where there is an interaction of the protein with the labeled GAGs, the migration of the GAGs is retarded during electrophoresis. The Kd values are calculated as described in the text as a function of the protein concentration and the electrophoretic mobility shift of GAGs in each lane.

