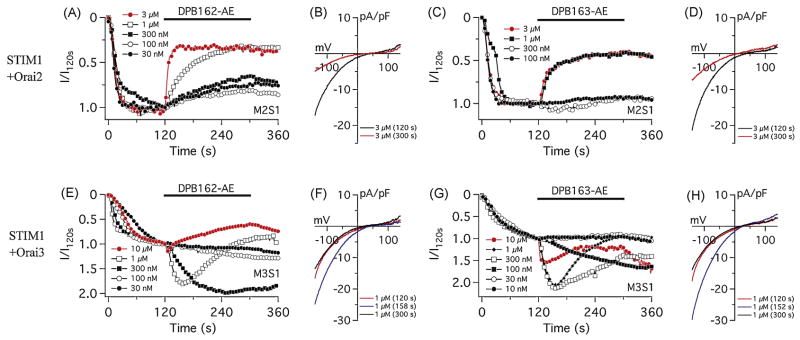
Fig. 4.
Differential effects of 2-APB analogs on CRACM2/Orai2 and CRACM3/Orai3. (A and C) Average CRAC current densities in STIM1 and CRACM2/Orai2 expressing HEK293 cells. DPB162-AE (A) or DPB163-AE (C) was applied 120 s after whole-cell establishment. Each trace represents 3 μM (n = 3), 1 μM (n = 3), 300 nM (n = 4), 100 nM (n = 4) and 30 nM (n = 3) of DPB162-AE in A, and represents 3 μM (n = 3), 1 μM (n = 3), 300 nM (n = 5) and 100 nM (n = 3) of DPB163-AE in C. (B) Average I/V relationships of ICRAC of representative concentrations of DPB162-AE shown in F. Data represent ICRAC before (at 120 s) and after (at 300 s) the application of 3 μM DPB162-AE. (D) Average I/V relationships before and after the application of DPB163-AE. (E and G) Average CRAC current densities at −80 mV in STIM1 and CRACM3/Orai3 expressing HEK293 cells. Initial activation of ICRAC and application of compound were performed same way as in Fig. 3A, C. Compound application induces transient or prolonged activation of CRACM3/Orai3 current depending concentration. Each trace represents 10 μM (n = 4), 1 μM (n = 3), 300 nM (n = 5), 100 nM (n = 4) or 30 nM (n = 4) of DPB162-AE in E, and represents 10 μM (n = 3), 1 μM (n = 6), 300 nM (n = 5), 100 nM (n = 4), 30 nM (n = 4) or 10 nM (n = 3) of DPB163-AE in G. (F) Average I/V relationships of ICRAC of representative concentrations of DPB162-AE shown in E. Data represent ICRAC before (at 120 s), during (at 158 s) and at the end (at 300 s) of the application of 1 μM DPB162-AE. (H) Average I/V relationships of CRAC currents of representative concentrations of DPB163-AE shown in G. Data represent CRAC currents before (at 120 s), during (at 152 s) and at the end (at 300 s) of the application of 1 μM DPB163-AE.

