
Figure 1.
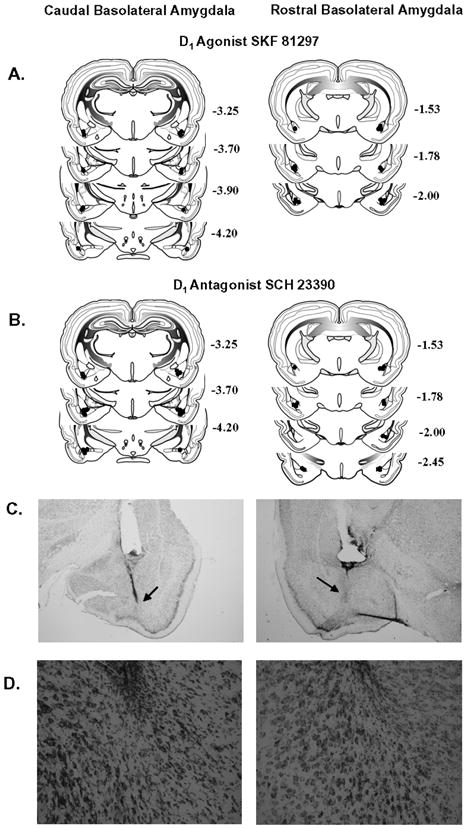
Schematic drawings representing coronal sections of the cBLA (left) and rBLA (right) subregions. Circles indicate the location of the infusion cannula tip in the SKF 81297 study (A) and SCH 23390 study (B). All drawings are based on the atlas of Swanson (1992), with the anterior-posterior references measured from bregma. Each placement is shown at the midpoint of its anterior-posterior extent. (C) Representative low magnification (2X) photographs of guide cannulae placements within the cBLA (left) and rBLA (right); arrows indicate infusion cannulae tracks, and (D) representative high magnification (20X) photographs of microinjection areas within the cBLA (left; SKF 81297 infusions) and rBLA (right; SCH 23390 infusions).