Figure 6.
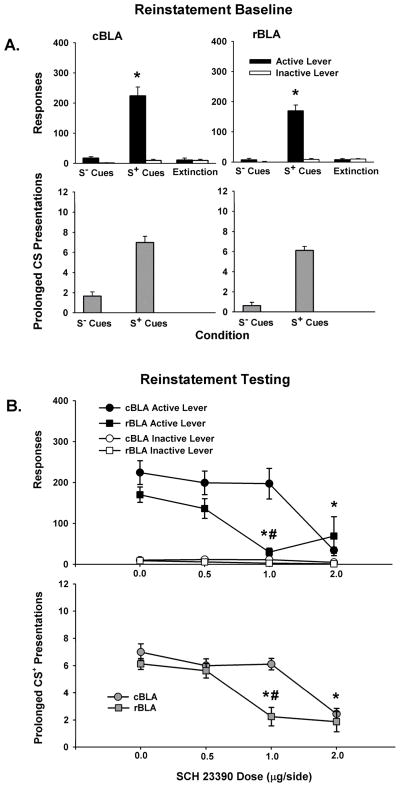
Baseline behavior during S− (saline-associated) and S+ (cocaine-associated) cue reinstatementsessions and response extinction sessions for the cBLA (left) and rBLA (right) groups of subjects, as well as reinstatement test session behavior after 0.0–2.0 μg/side SCH 23390 infused into the cBLA and rBLA. Values are the mean ± SEM number of active and inactive lever responses (A-B, top) and number of prolonged CS or CS+ light presentations earned (A-B, bottom). * p ≤ 0.05 compared to responding during S− and extinction conditions or compared 0.0 μg/side SCH 23390, and # p ≤ 0.05 compared to the same condition in the cBLA group.

