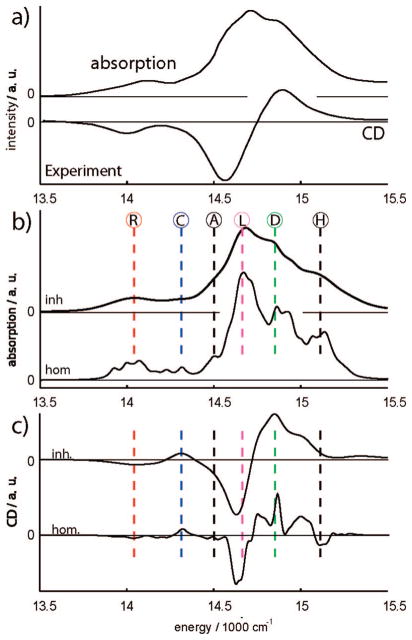
Figure 5.
(a) Experimental absorption (80 K) and CD (77 K) spectra of the PSI complex adapted from ref 24. The spectra have been converted from the wavelength to the energy scale using κω ∝ λ2κλ. (b) Absorption of the PSI complex; “inh” denotes full simulations averaged over 1000 diagonal disorder configurations, “hom” is homogeneous model. R, red excitons; C, RC peak; A, bulk antenna lower edge; L, linker states; D, delocalized states over most of the antenna; H, bulk antenna higher edge. (c) Same simulations but for the circular dichroism (CD) spectrum.

