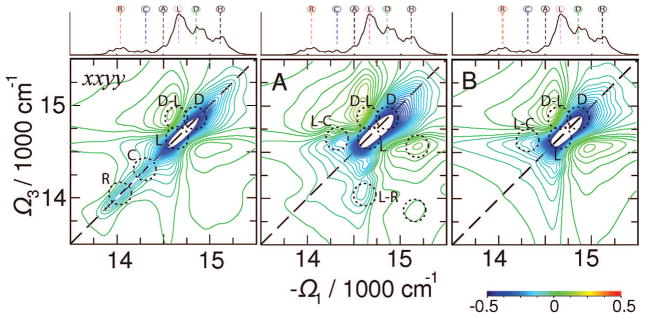
Figure 6.
Left: xxyy tensor component of the 2D signal . Middle: signal A(Ω3,t2= 1 fs,Ω1). Right: signal B(Ω3,t2= 0,Ω1). Absorptive (Im) parts of the signals are shown. The 2D plots are normalized to their maximum. All signals have been averaged over 500 diagonal disorder configurations. Top marginal: the homogeneous absorption spectrum.

