Figure 1.

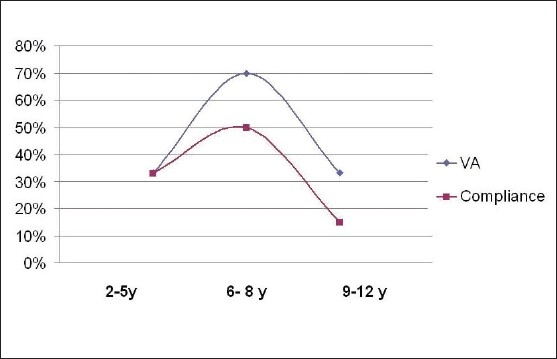
Correlation of visual acuity progress and age with compliance to occlusion therapy. Improvement in visual acuity correlated with good compliance (P = 0.001)

Correlation of visual acuity progress and age with compliance to occlusion therapy. Improvement in visual acuity correlated with good compliance (P = 0.001)