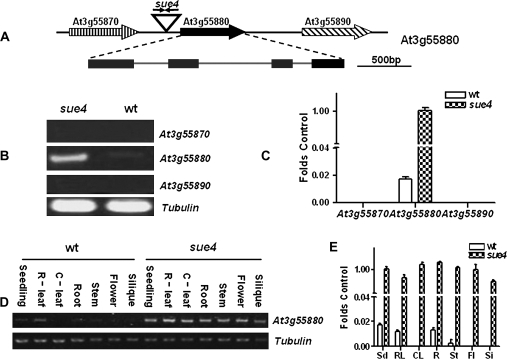
Fig. 9.
At3g55880 locus is activated in sue4 mutant. (A) Illustration of At3g55880 locus in sue4. Two copies of T-DNA were inserted in an inverted orientation at position 20597, 1758 bp downstream from the stop codon of At3g55870 and 930 bp upstream from the ATG codon of At3g55880. (B) RT-PCR analysis of transcript levels of the neighbouring genes. Transcript levels for At3g55870, At3g55880, and At3g55890 were compared in the wild type and the sue4 mutant. The experiment was repeated three times, and a typical result is presented. (C) Real-time RT-PCR analysis of transcript levels of the neighbouring genes. Using the same samples and primers as in (B), real-time RT-PCR was performed for 30 cycles. The relative transcript level was obtained as folds of the tubulin transcript level, which was used as the internal control. Values represent the mean of three experiments and error bars represent SEM. (D) RT-PCR analysis of the expression patterns of At3g55880 in the mutant and the wild type. RNA was isolated from seedlings (Sd), roots (R), rosette leaves (R-leaf), cauline leaves (C-leaf), inflorescence stem (St), flowers (Fl), and siliques (Si) of the wild type and sue4 plants, respectively. Tubulin was used as a loading control. The experiment was repeated three times, and a typical result is presented. (E) Real-time RT-PCR analysis of the expression patterns of At3g55880 in the mutant and the wild type. Using the same samples and primers as in (D), real-time RT-PCR was performed for 30 cycles. The relative transcript level was obtained as folds of the tubulin transcript level, which was used as the internal control. Values represent the mean of three experiments and error bars represent SEM.

