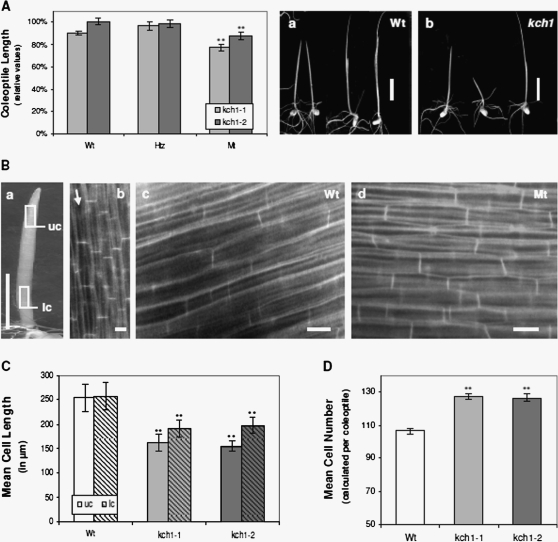
Fig. 2.
Phenotype of Tos17 insertion mutants. (A) Coleoptile length in etiolated seedlings 7 d after germination. For both mutant lines, kch1-1 (light grey), and kch1-2 (dark grey), in addition to homozygous mutant plants (Mt), heterozygotes (Htz), and the segregating wild types (Wt) were analysed. Coleoptile length plotted relative to the cultivar Oryza sativa L. japonica cv. Nipponbare that was the background for the mutants. Mean values ±SE of a total of at least 50 measurements are given, collected cumulatively over several independent experimental series. Asterisks indicate significant differences in both mutant lines between Mt and Wt/Htz as assessed by a t test for unpaired data; **P <0.01. Representative images of both Wt (a) and Mt (b) seedlings. Scale bar: 10 mm. (B, C) Cell length measurements in coleoptiles of etiolated seedlings 7 d after germination for kch1-1 (light grey), kch1-2 (dark grey) and wild-type (Wt, white) plants. Cell length were determined in the upper part (uc, open bars) and in the lower part (lc, hatched bars) of the coleoptile as marked in (a) by counting cross walls per cell file in the field of vision at the microscope as indicated in (b). Data represent mean values ±SE of a total of at least 150 analysed cell files, collected from 15 coleoptiles. Asterisks (**) indicate significant differences (P <0.01) between Mt and Wt as assessed by a t test for unpaired data. Representative fluorescence images of coleoptile cells are shown in (c) for the wild type and in (d) for the mutant. Scale bars:10 mm (a); 20 μm (b, c). (D) Mean cell numbers in coleoptiles of etiolated seedlings 7 d after germination for kch1-1 (light grey), kch1-2 (dark grey) and wild-type (Wt, white) plants. Mean values ±SE were estimated from the cell lengths determined in a total of at least 150 analysed cell files as described in (B). Asterisks (**) indicate significant differences (P <0.01) between Mt and Wt in t tests for unpaired data.

