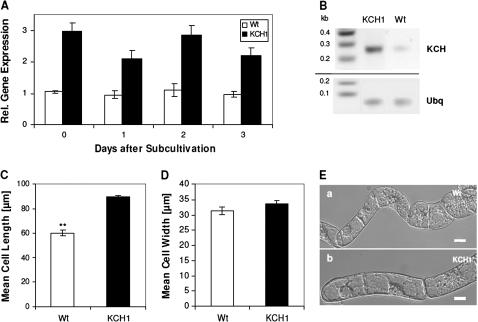
Fig. 4.
BY-2 cells overexpressing OsKCH1 are more elongated than wild-type cells. (A) Expression of KCH in non-transformed BY-2 wild-type cells (Wt, white) and BY-2 cells stably overexpressing OsKCH1 (KCH1, black). (B) Representative RT-PCR detection of KCH expression levels in BY-2 Wt and BY-2 KCH1. Ubiquitin (Ubq) was used as internal standard in all samples. (C) Cell length in BY-2 Wt and BY-2 KCH1. Mean values ±SE of a total of 300 analysed cells per sample, collected cumulatively in three independent experimental series are given. Asterisks (**) indicate P <0.01 as evaluated by a t test for unpaired data. (D) Cell width in BY-2 Wt and BY-2 KCH1. For details refer to (C). (E) Representative DIC images of (a) BY-2 Wt and (b) BY-2 KCH1 cells to show the differences in cell length. Scale bars: 20 μm.

