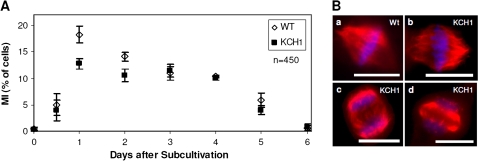
Fig. 5.
Mitosis in BY-2 KCH1 cells is delayed but morphologically normal. (A) Time-course of mitotic indices (MI) in BY-2 Wt and BY-2 KCH1. Mean ±SE in per cent of cells of a total of 450 analysed cells per time point and sample, collected cumulatively from three independent experimental series with 150 cells per series are given. (B) Microscopic analysis of mitotic spindles in BY-2 Wt (a) and BY-2 KCH1 (b), as well as phragmoplasts (c, d). Microtubules were stained by immunofluorescence, the DNA visualized by Hoechst staining. Scale bars: 20 μm. (This figure is available in colour at JXB online.)

