
Figure 2.
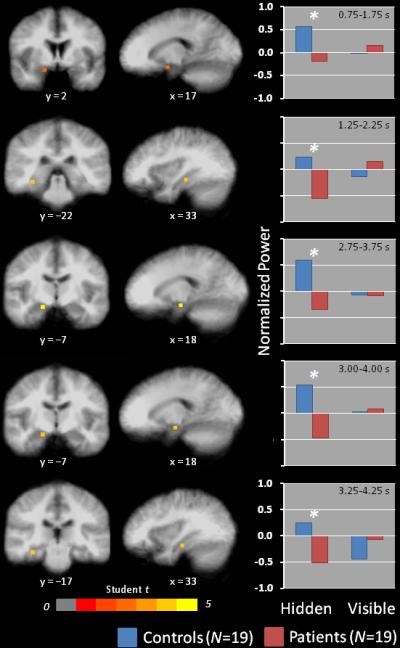
Peak differences in regional theta (4-8 Hz) activity in right medial temporal cortices between healthy controls (N = 19) and depressed patients (N = 19) on hidden platform trials. Coronal and sagittal views of differential activations are overlayed on an averaged anatomical MRI, presented in radiological orientation (left = right, right = left). Bar graphs show mean theta power by Group and Condition at the local maximum for each time window depicted in the images. *false discovery rate < 5%.