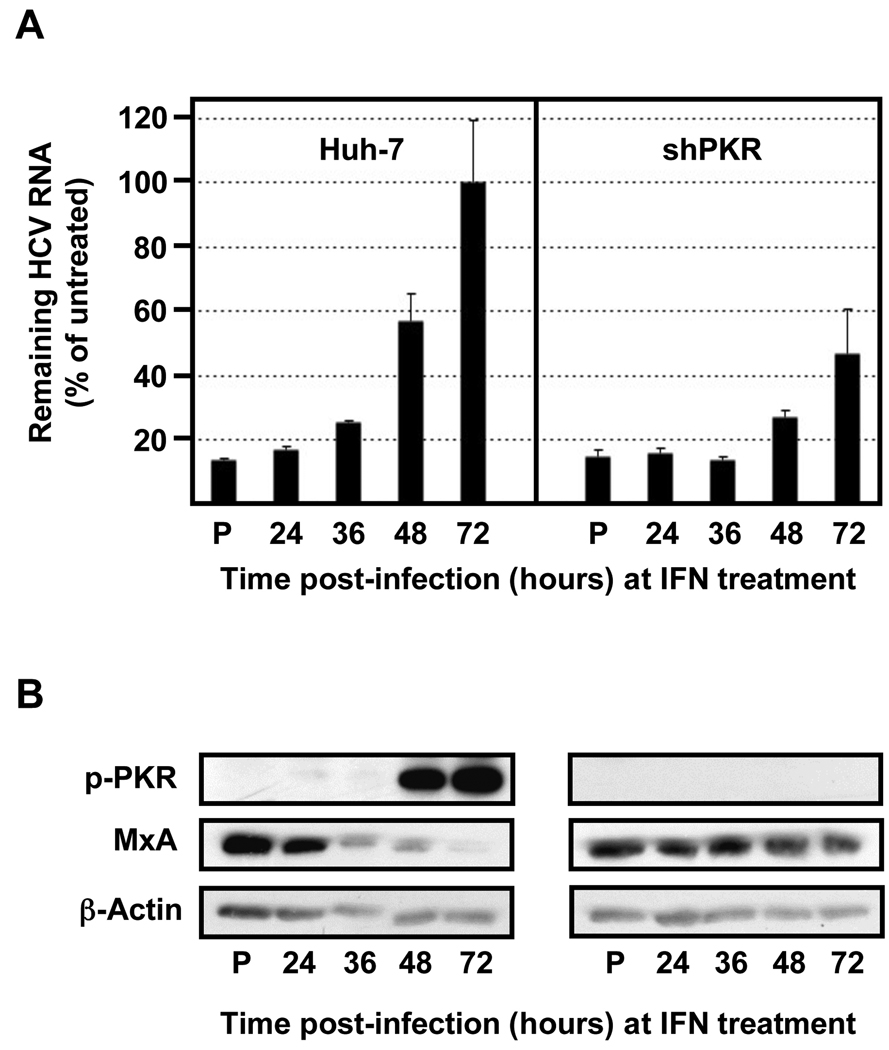
Fig. 7. The HCV resistance to IFN correlates with PKR phosphorylation and is inversely related to ISG protein expression.
Huh-7 cells were transduced with lentiviral vectors expressing shRNAs against PKR, as indicated in Figure 6. Transduced and control cells were pre-treated with 100 U/ml of IFN (P) or remain untreated (the rest). After 16 hours all the cells were infected with JFH-1 d183 virus at moi=3 and at the indicated times post infection cells were treated with 100 U/ml of IFNβ for 20 hours, after which cellular extracts were prepared for RNA and protein analysis. (A) The HCV RNA present in those samples was analyzed by RT-qPCR. The quantification of GAPDH mRNA was used for normalization. Data are displayed as percentage of remaining HCV RNA in IFN-treated samples relative to that in the untreated ones at each time point. Bars in the graph represent the Mean ± AVEDEV; n=3. The graph is representative of 2 independent experiments with 3 replicas per sample. (B) Equivalent amounts of total protein from samples generated in parallel were analyzed by Western-blotting for MxA and p-PKR protein detection. β-actin expression was examined as protein loading control. Panels are representative of 2 independent experiments.

