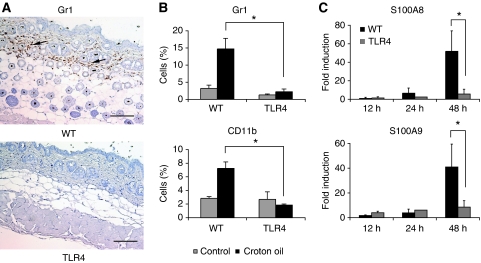
Figure 3.
Recruitment of inflammatory cells in the skin after croton oil treatment. The skin from WT and TLR4 KO mice was collected 24 h after single treatment with CO and analysed for immune infiltrates. (A) Representative immunohistochemistry showing Gr1 staining of granulocytes in the skin of WT and TLR4 KO mice. Arrows show immune cell infiltrates. Scale bar, 100 μm. (B) FACS analysis showing the recruitment of granulocytes (Gr1) and monocytes/phagocytes (CD11b) in the skin. Values represent means±s.d. of the mean from at least three skin samples from each genotype and each experiment was repeated at least twice. *P<0.05, NS, not significant. (C) Real-time PCR analysis for S100A8 and S100A9 in the skins from WT and TLR4 KO mice 12, 24 and 48 h from CO treatment. Data represents fold induction of mRNA levels relative to acetone-treated animals after normalization to ribosomal protein L32. Values represent means±s.d. of the mean from at least five skins from each genotype. *P<0.05. The experiment was repeated twice with similar results.

