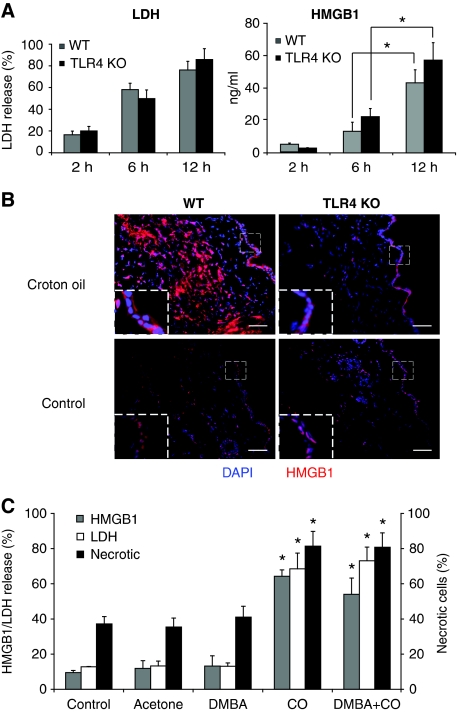
Figure 6.
Croton oil or TPA treatment induces release of HMGB1, LDH and necrosis of keratinocytes. (A) Release of LDH (left panel) and HMGB1 (right panel) in skin culture supernatants. The skins were removed at the indicated time points after single treatment with TPA and cultured in medium to reach 24 h from the initial TPA treatment. Values represent means±s.d. of the mean from at least three mice from each group and the experiment was repeated at least twice. (B) Immunofluorescence staining of HMGB1 (red) after 18 h croton oil treatment of WT (left, top) and TLR4 KO mice (right, top) in comparison with the control skin from respective mice (bottom). Scale bar=250 μm. Insets show higher magnification of the areas reported in the dashed line boxes ( × 2.5). Nuclei are stained with dapi (blue). Images are representative of at least five mice from each genotype. One representative image is shown per mouse. One experiment of three is shown. (C) Primary mouse keratinocytes were isolated and kept in culture as described in Materials and methods section. A total of 1.5 × 10⁵ cells were treated with DMBA (1 μM) or croton oil (0.5 mg/ml) and cell supernatant was collected after 16 h. Cells were collected for FACS analysis 4 h after treatment with DMBA or croton oil and stained with Annexin V and propium iodide. Supernatant was analysed for the release of LDH and HMGB1. Lysis buffer from a cytotoxicity assay kit was used as a positive control to measure total LDH. The graph shows the percentage of HMGB1 and LDH release (left y axis), and the percentage of necrotic cells (right y axis) compared with cells treated with lysis buffer (positive control) from the same experiment. *P<0.05 between CO or DMBA+CO groups versus control, acetone (Ac) or DMBA groups.

