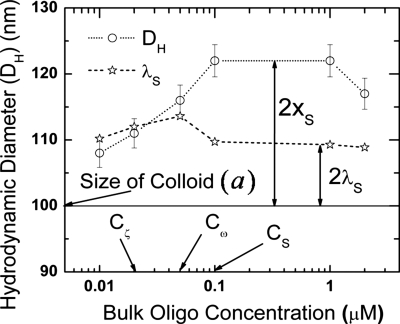
Figure 2.
Variation in hydrodynamic diameter DH and shift in shear slip plane xS with change in bulk oligonucleotide concentration. The position of the collapsed layer λS, estimated from the crossover frequency, is also indicated for all the bulk concentrations. The important critical bulk oligonucleotide concentrations Cζ, Cω, and CS (as defined in Fig. 1) are also shown.

