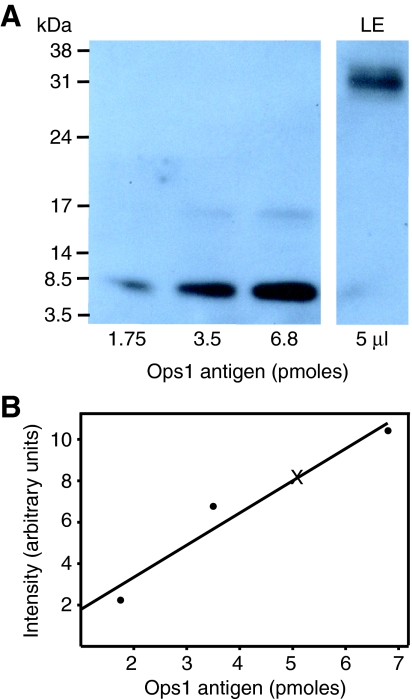
Fig. 11.
Sample quantification of opsin in photoreceptor membranes. (A) Chemiluminescent image of Ops1-2-immunoreactivity (Ops1-2-ir) obtained with known amounts of Ops1 antigen and a known volume (5 μl) of lateral eye (LE) membranes from a night-time eye. (B) Standard curve obtained by quantifying the immunoreactive intensity of the antigen standards shown in A (R2=0.99). The intensity of Ops1-2-ir in 5 μl of the LE membrane preparation is indicated on the curve (X).

