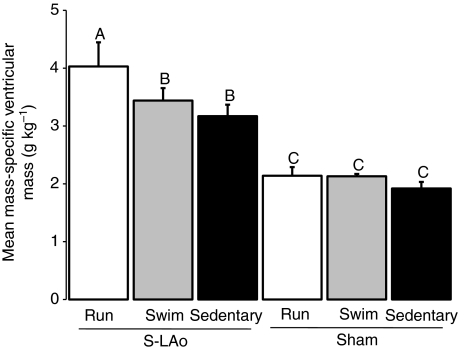
Fig. 4.
Mean values for mass-specific combined ventricular mass (g kg–1) for all subgroups. Uppercase letters above error bars indicate significant differences for each group, derived from Student–Newman–Keuls post-hoc test (α=0.05A,B,C) following 1-way ANOVA (F5,52=26.84, P<0.001). S-LAo Run N=8, S-LAo Swim N=8 and S-LAo Sedentary N=8; Sham Run N=11, Sham Swim N=12 and Sham Sedentary N=11. Error bars are s.e.m.

