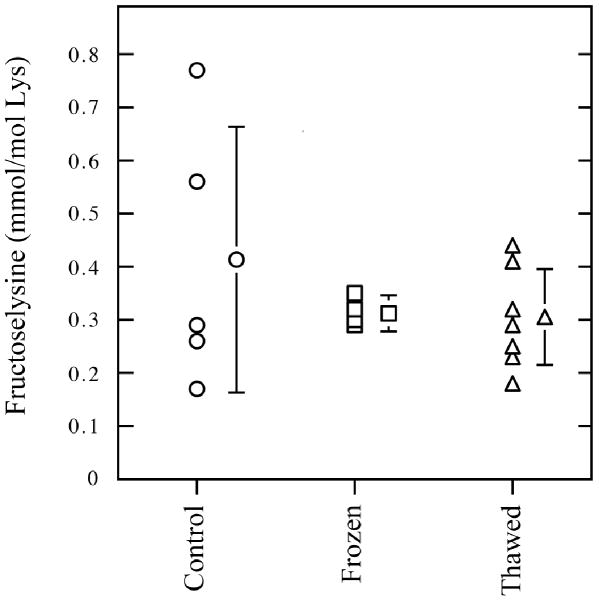
Figure 1.
Fructoselysine levels as measured by GS/MS in blood plasma of control (○), frozen (□), and thawed (△) wood frogs. Control frogs were kept at 5 °C, frozen frogs were frozen at -2.5 °C for 27 h plus 1 h thaw time (to facilitate blood sampling), and thawed frogs were recovered at 5 °C for 18 h after a 24 h freeze. Data are means ± SEM, n = 5-7.

