Figure 2.

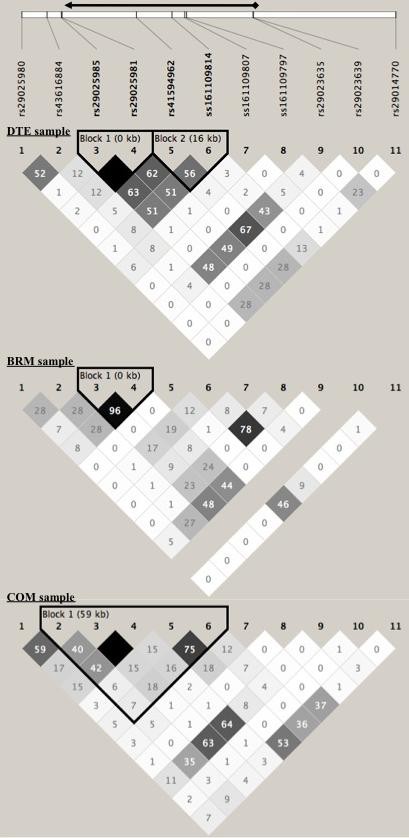
Linkage Disequilibrium (LD), r2 values, between all markers at the ITGA11 gene region. The black arrow on the top represents the relative position of the ITGA11 gene.

Linkage Disequilibrium (LD), r2 values, between all markers at the ITGA11 gene region. The black arrow on the top represents the relative position of the ITGA11 gene.