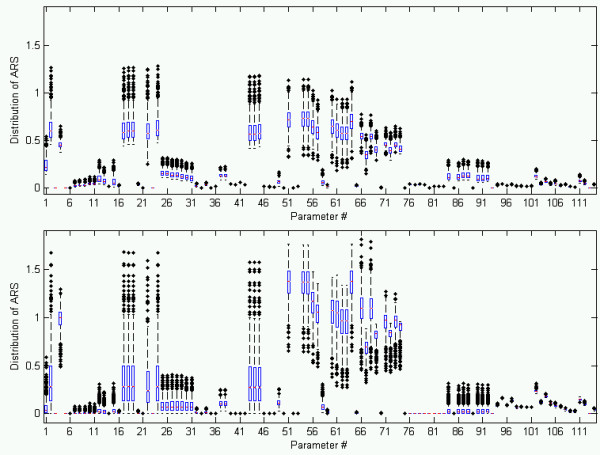
Figure 4.

The average relative sensitivity (ARS) for each parameter and state was calculated over time for 1000 parameter generations. Sensitivity was then averaged over all states and time for each parameter and its boxplot is shown to illustrate the sensitivity distribution.
