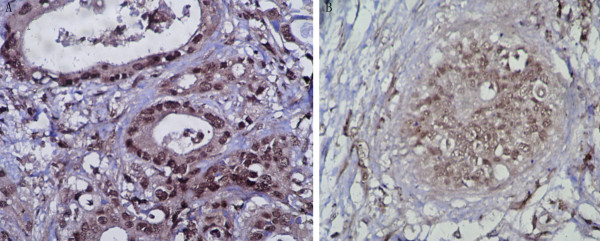
Figure 1.
Representative example of the E-cadherin expression determined by immunohistochemistry. A, carcinoma cells showed strong expression (preserved pattern) in the Slug nonoverexpression case. B, carcinoma cells showed weak expression (reduced pattern) in the Slug overexpression case. (magnification, ×400).

