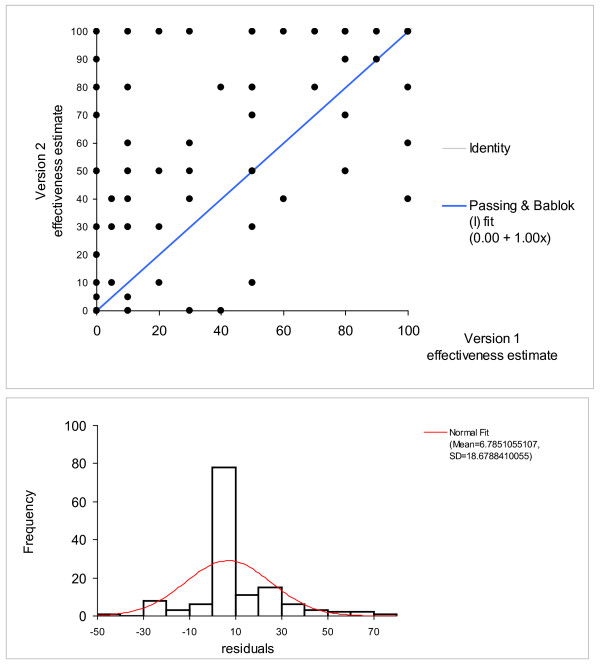
Figure 2.
Repeatability, scatter blot and histogram of residuals according to Passing-Bablok, n = 490 [34]. The variability of the estimates may be overestimated in scatter blot. The histogram of residual reveals that many estimates lie close to zero. Consistently, the slope of the diagram is one, the intercept zero.

