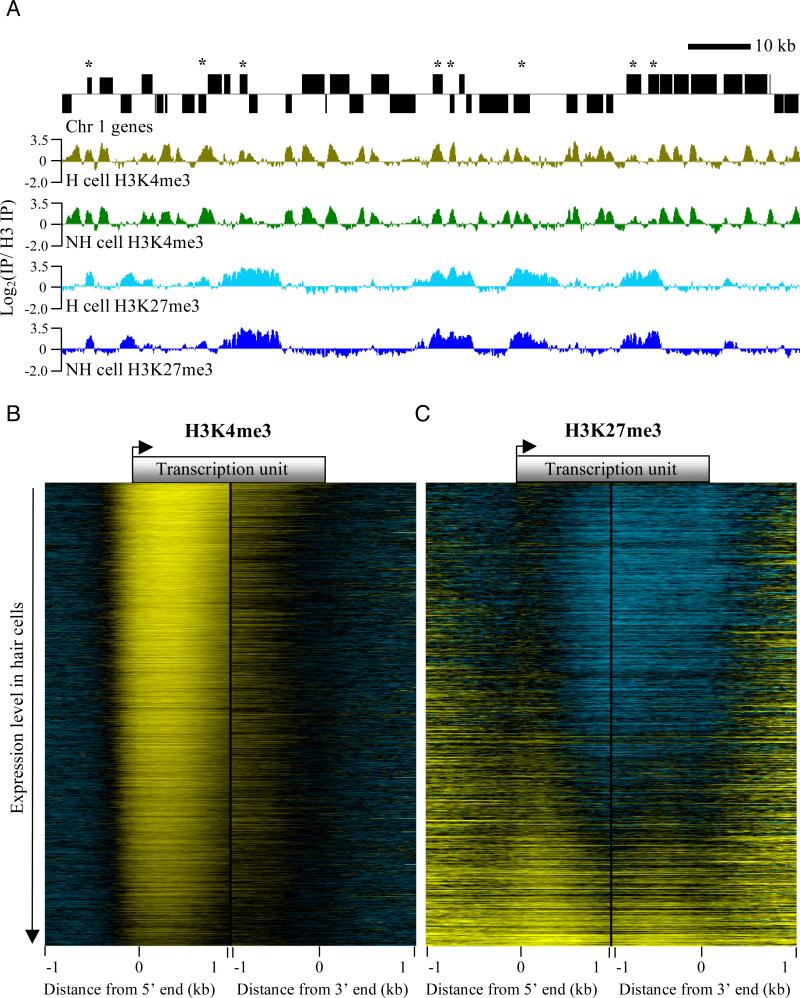
Figure 3. Overview of ChIP data obtained from INTACT-purified nuclei.
(A) Representative euchromatic chromatin landscapes of H3K4me3 and H3K27me3 in hair (H) and non-hair (NH) cells. Chromosome 1 genes are shown above the chromatin tracks. Genes on the top strand are shown above the black line and those below the line are on the bottom strand. Asterisks indicate genes where H3K4me3 and H3K27me3 overlap in both cell types. Each chromatin landscape is the average of two biological replicates, displayed on the same log-ratio scale. (B) Heat map of the H3K4me3 chromatin landscape relative to gene ends in H cells (-1 kb to +1 kb relative to transcription start and end sites). Genes are ranked from highest to lowest expression level in H cells. Yellow indicates positive, black indicates zero, and blue represents negative log2 ratios. (C) Same as in (B) but for the H3K27me3 chromatin landscape. Heatmaps made the same way for each modification in non-hair cells showed a nearly identical pattern to those in hair cells, as shown in Figure S4. See also supplementary table 5.

