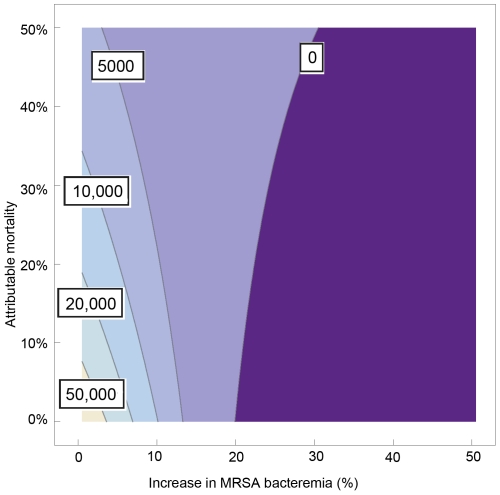
Figure 3. Mixing replacement and addition scenarios.
Costs per life year gained as a function of the absolute increase in MRSA bacteremia incidence (horizontal axis) and the rate of attributable mortality of MRSA as compared to methicillin-sensitive Staphylococcus aureus (MSSA) (vertical axis) for the scenario that 50% of all S. aureus bacteremias cases are caused by MRSA.

