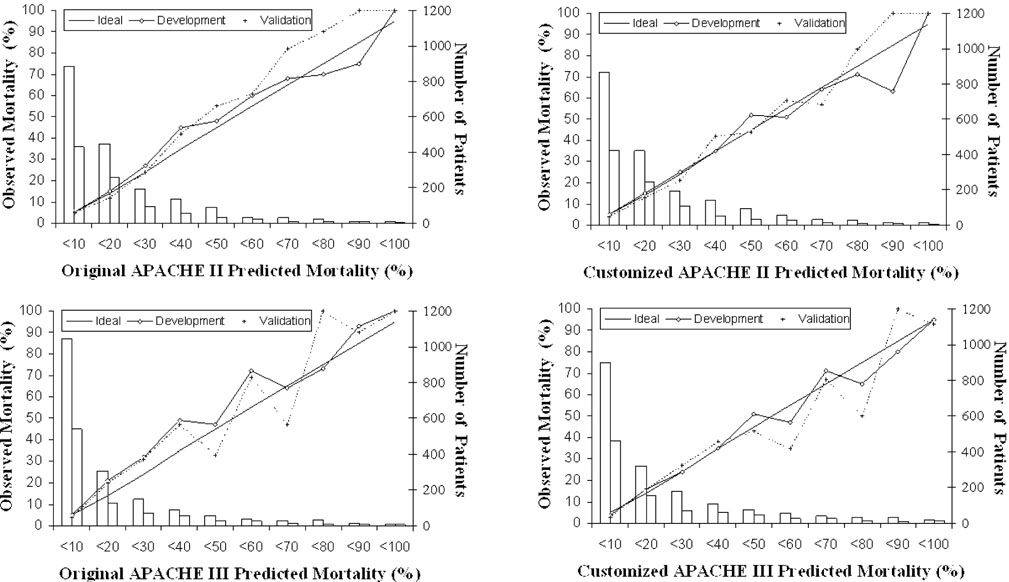
Figure 1.

Calibration curves for APACHE II and APACHE III before and after customization for development and validation samples. The diagonal line is the line of ideal correspondence between observed and expected mortality. The solid line represents the development sample and the dotted line the validation sample. Case numbers for the development sample are represented by white bars, and those of the validation sample by grey bars.
