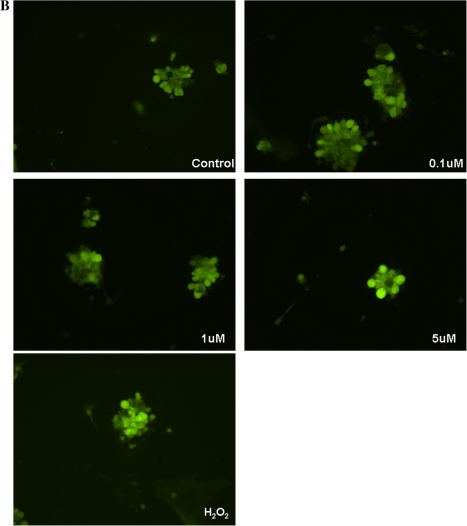
FIG. 4.
DCF fluorescence levels in living microglial cells were visualized by microscopy. (A) Microglial cells were treated with MeHg at the concentrations indicated in the figures; 100μM H2O2 was used as a positive control for 1 min. (B) Microglial cells were treated under the same concentrations for 10 min. The intensity of the fluorescence signal was indicative of the intracellular ROS production. Photographs show representative fields observed from three independent experiments.


