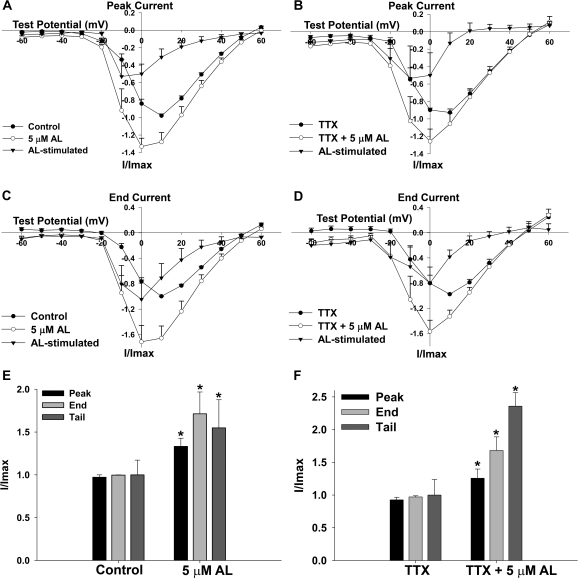
FIG. 2.
Allethrin increases peak, end, and tail VGCC current and shifts the current-voltage relationships (I-V curves) to more hyperpolarized potentials. (A and B) I-V curves of peak currents for cells exposed to AL in the absence (A, n = 6 cells) or presence (B, n = 5 cells) of 0.5μM TTX. Maximum peak current is shifted from 10 to 0 mV in both cases. The peak AL-stimulated current maximizes at −10 mV. (C and D) I-V curves of end currents for cells exposed to AL in the absence (C, n = 6 cells) or presence (D, n = 5 cells) of 0.5μM TTX. Maximum end current is shifted from 10 to 0 mV, and the AL-stimulated current exhibits maximum amplitude at 0 mV. (E–F) Peak and end currents represent the maximum values from (A–D), which occurred at 10 mV before AL exposure and 0 mV after AL exposure. Tail current represents the magnitude of the tail current present after repolarization to −70 mV from a test potential of 0 mV (Fig. 1). All three parameters of VGCC current increased during AL exposure, even in the presence of 0.5μM TTX. Data were analyzed by paired t-test, n = 6 cells for (E) and n = 5 cells for (F). The asterisk depicts a statistically significant difference (p < 0.05).

