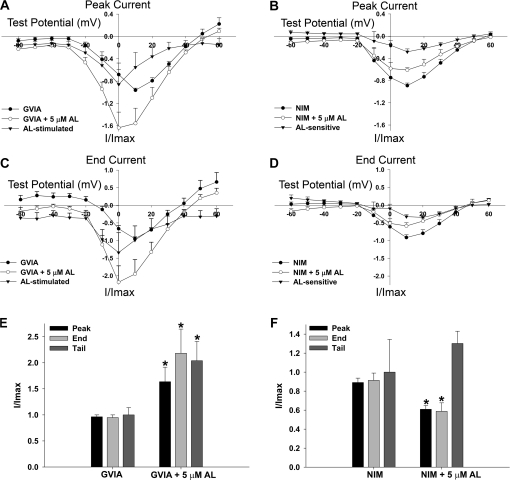
FIG. 5.
Shift in peak and end VGCC I-V curves is because of AL interaction with L-type VGCCs. (A and B) I-V curves of peak currents for cells exposed to AL following pretreatment with GVIA (A, n = 6 cells) or continuous perfusion with NIM (B, n = 5 cells). Peak current is shifted from 10 to 0 mV in GVIA-treated cells but not in NIM-treated cells. The peak AL-stimulated current maximizes at 0 mV in GVIA-treated cells. NIM-treated cells exhibited an apparent decrease in peak current during exposure to AL, with maximum AL-sensitive current at 10 mV. (C and D) I-V curves of end currents for cells exposed to AL following pretreatment with GVIA (C) or continuous perfusion with NIM (D). Maximal end current is shifted from 10 to 0 mV, and the AL-stimulated current exhibits maximum magnitude at 0 mV in GVIA-treated cells. NIM-treated cells exhibited an apparent decrease in end current, with maximum AL-sensitive current at 10–20 mV. (E and F) Peak and end currents represent the maximum values from (A–D). Tail current represents the magnitude of the tail current measured after repolarization to −70 mV from a test potential of 0 mV. All three parameters of VGCC current were increased during AL exposure in GVIA-treated cells (E), whereas AL mediated a reduction of peak and end current in NIM-treated cells (F). Data were analyzed by paired t-test, n = 7 cells for (E) and n = 5 cells for (F). The asterisk depicts a statistically significant difference (p < 0.05).

