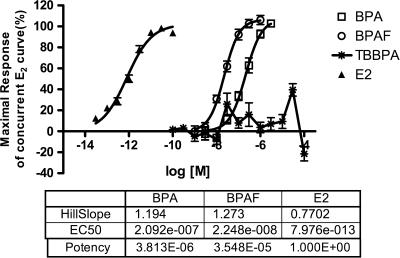
FIG. 1.
T47D-KBluc assay ER transcriptional activation dose-response of individual chemicals, E2, BPA, BPAF, and TBBPA, fitted with a nonlinear regression (variable slope) curve. The EC50 and hillslope values were calculated through GraphPad Prism 5.01. Relative potency calculated by dividing EC50 values of individual compounds by E2 EC50 value. Data are plotted as mean ± SE. E2 n = 12; BPA n = 12; BPAF n = 15; TBBPA n = 15.

