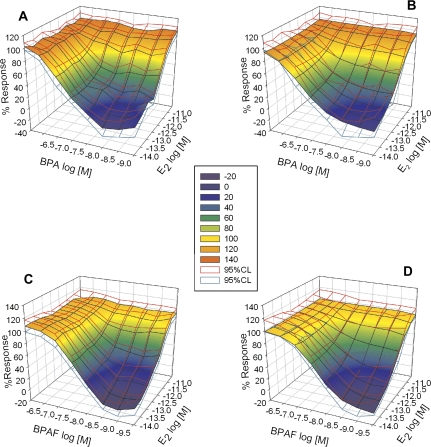
FIG. 2.
Predictions of dose-addition data generally fall within 95% CLs of the observed data. Observed (A and C) and dose-addition modeled data (B and D) compared with 95% CLs from observed data (red = upper CL, dark cyan = lower CL) for binary mixtures of BPA plus E2 (A and B) and BPAF plus E2 (C and D).

