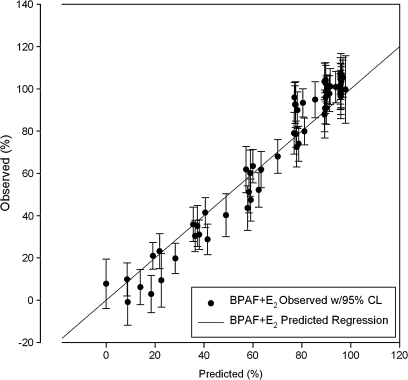
FIG. 6.
Binary mixture of BPAF plus E2 shows good correlation between predicted and observed data. Regression line plots the predicted EEQ of the binary mixtures for both axis x and y. Individual points plot the means with 95% CL of observed results on the y-axis and predicted EEQ on the x-axis. The scatter allows for the evaluation of the efficacy of the EEQ model.

