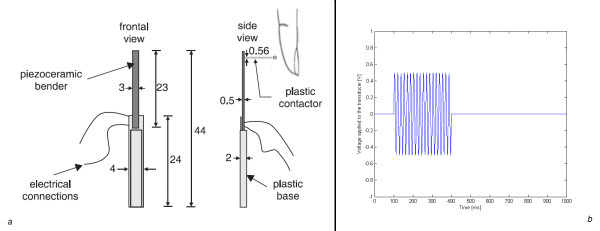
Figure 5.
Experimental setup. (a) Schematic representation of the piezoelectric stimulator, the plastic base and the plastic contactor. The numbers indicating length, width and height are expressed in millimeters. (b) Voltage waveform applied to the piezoelectric stimulator in each trial, showing the 250 Hz sinusoidal burst (not in scale) within the 1 s presentation interval.

