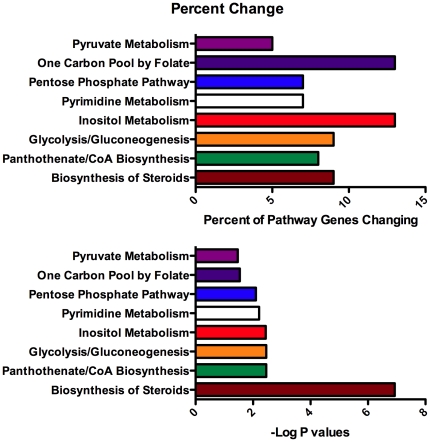
Figure 2. Metabolic functions of genes increasing expression after 24 hours in response to inhibitors of V-ATPase, but not responding to low cholesterol or iron chelation.
The genes in Table S4 were analyzed with Ingenuity Pathways to assign them to canonical pathways. The percent of genes in the pathway represented in this data set, and the significance of the change are shown.

