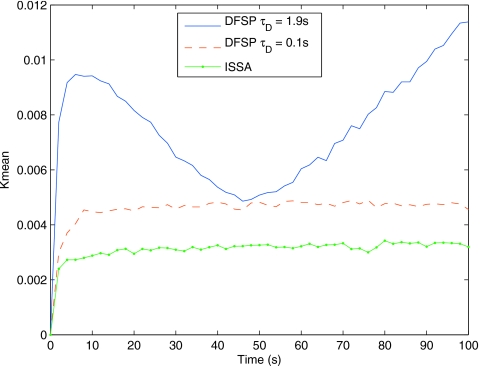
Figure 9.
The distribution distance for the G-protein cycle example, the Kmean from Eq. 10 at every 100 s for 7000 s for ISSA-vs-ISSA (green line with dots), ISSA-vs-DFSP with τD=0.1 s (dashed red line) and τD=1.9 s (blue line). In this plot the ensemble size is 105, at which point the DFSP solution becomes distinguishable from the ISSA solution for larger time steps. For ensemble sizes ≤103, the DFSP solution is indistinguishable from the ISSA solution for both step sizes (results not shown).

