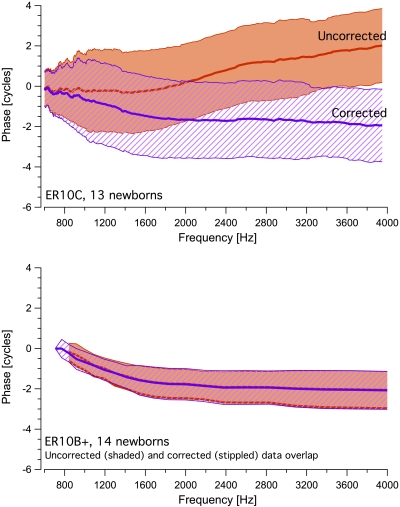
Figure 3.
The newborn phase data displayed in Fig. 1 are shown again in this graphic. The stippled region represents the corrected phase derived by subtracting 2ϕ1-ϕ2 from the estimated phase of the DPOAE, where ϕ1, ϕ2 are the measured phases of the two primary tones. The shaded region represents the uncorrected phase values. Because of the significant overlap, the two regions are staggered slightly for display purposes in the lower panel.

