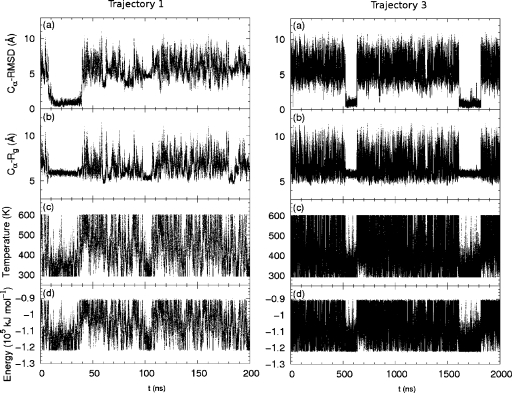
Figure 6.
Trpzip2: quantities along two independent simulation trajectories. Left: the first 200 ns of a fast-folding trajectory (trajectory 1). Right: 2 μs of trajectory 3. Panels from top to bottom: (a) Cα-RMSD from native structure, (b) Cα radius of gyration, (c) temperature, and (d) potential energy.

