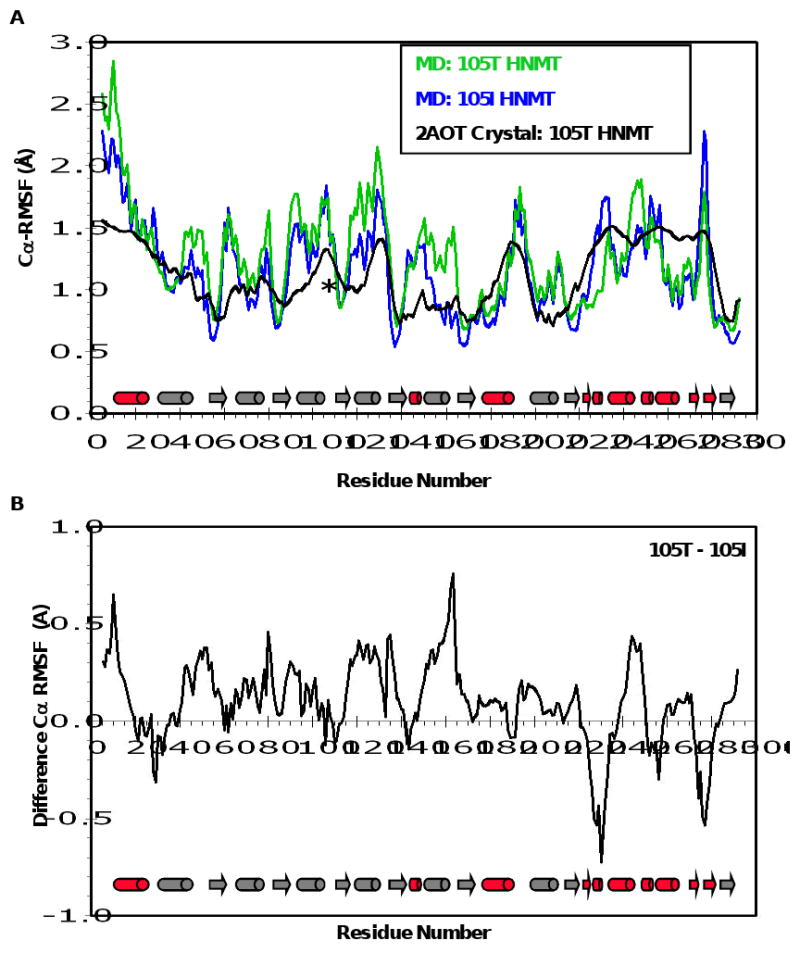
Figure 2. Mobility of HNMT during MD.

(A) Cα-RMS fluctuations (Å) per residue from the 105T (green) and 105I (blue) MD simulations at 37°C. Cα-RMSFs were calculated relative to the average structure over the last 10 ns of each simulation. Experimental B-factors of the 105T HNMT crystal structure (2AOT, (28)) are colored in black. (B) Cα-RMSF difference plot for the HNMT simulations. Positive and negative values indicate greater overall fluctuations in the 105T and 105I HNMT proteins, respectively. Secondary structural elements are depicted as  for α-helices, and
  for β-strands, and are colored to match the SAM- and histamine-binding domains shown in Figure 1. * = residue 105.
