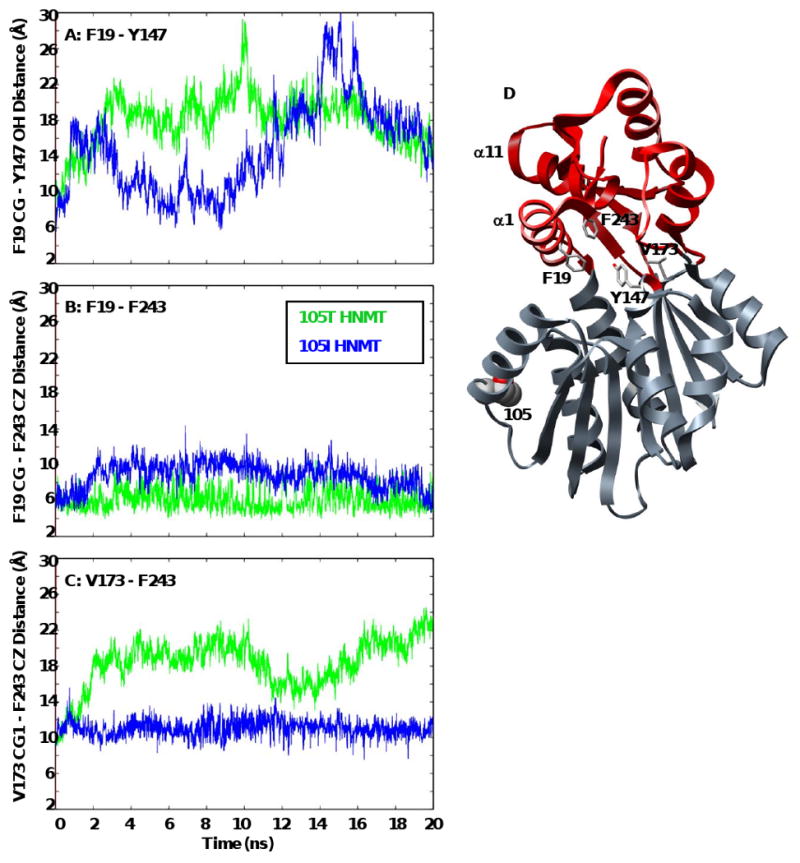
Figure 4. Distances between core residues within the histamine-binding domains of 105T and 105I HNMT.

The contact distances between core residues within the histamine-binding domain (F19-Y147, V173-F243) fluctuate greatly with time, reflecting the periodic breathing motion of HNMT that may facilitate substrate binding. The distance between F19 and F243 is more constant throughout the simulations, as α1 and α11 remain in contact and move together. The figures shows plots of (A) F19 CG (α1) – Y147 OH (α6), (B) F19 CG (α1) – F243 CZ (α11), and (C) V173 CG1 (β5) – F243 CZ (α11) contact distances with time for the 105T (green) and 105I (blue) HNMT simulations at 37°C. (D) Ribbon diagram of HNMT showing the positions of residues F19, Y147, V173 and F243 within the histamine binding domain (red). Residue side-chains are shown in licorice representation and colored by atom.
