
Figure 2.
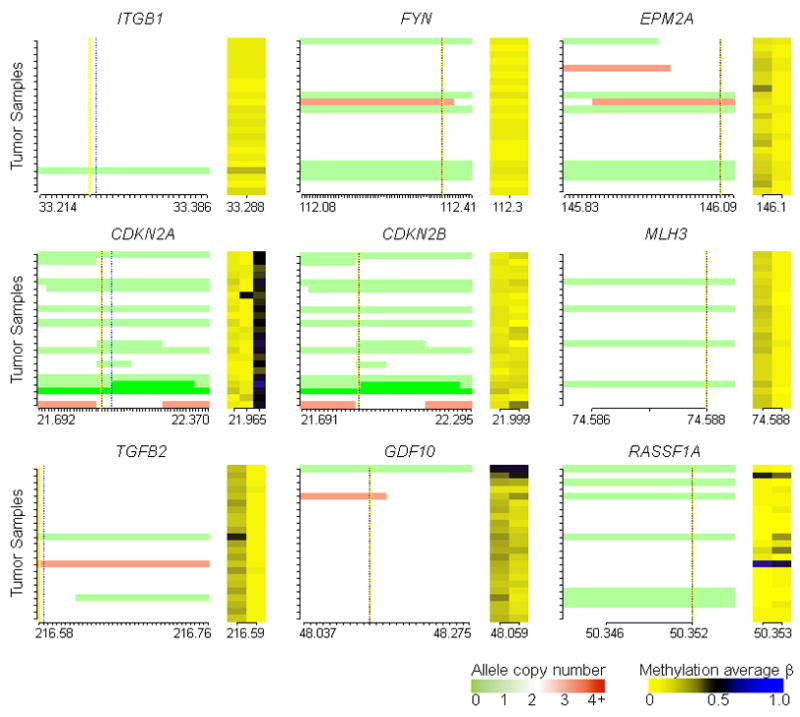
Gene-specific integrated copy number and methylation plots indicate a lack of coordinate copy number loss and hypermethylation events in mesotheliomas. Each ordinate tick mark represents a tumor sample, equivalently ordered across individual plots. In the left portion of the plot for each gene vertical yellow and dashed lines mark the positions of the TSS and CpG loci respectively, red represents amplified alleles, white represents two alleles, and green represents deleted alleles. The abscissa displays a tick mark for each SNP on the mapping array arranged 5′ to 3′ for each gene, and lists the first and last chromosomal position for SNP probes plotted (x10−6, not scaled to genomic distance) and the position of the CpG(s)(x10−6). The right portion of each plot shows methylation average β values, dark blue for fully methylated and bright yellow for unmethylated.