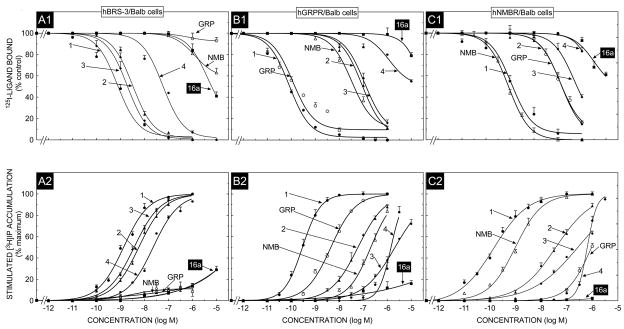
Fig. 2.
The ability of GRP, NMB, [DTyr6, βAla11,Phe13,Nle14]Bn(6-14) (Peptide # 1) and various putative BRS-3 selective agonists including peptide #16a, to inhibit binding and to stimulate an increase in [3H]IP formation at the hGRPR, hNMBR and hBRS-3 expressed in Balb 3T3 cells. In binding (top panel) Balb 3T3 cells stably transfected with hGRPR (0.3 × 10⁶ cell/ml), hNMBR (0.03 × 10⁶ cells/ml) or hBRS-3 (0.5 × 10⁶ cells/ml) cells were incubated for 60 min at 22°C with 50 pM I125- [DTyr6, βAla11,Phe13, Nle14]Bn(6-14), with or without the indicated concentrations of the various peptides added. Results are expressed as the percentage of saturable binding without unlabeled peptide added (percent control). Bottom panel, Balb 3T3 cells transfected with hGRPR, hNMBR or hBRS-3 were subcultured and preincubated for 24 h at 37°C with 3 uCi/ml myo-[2-3H]inositol. The cells were then incubated with the ligands at the concentrations indicated for 60 min at 37°C. Values expressed are a percentage of total [3H]IP release stimulated by 1 μM [DTyr6, βAla11,Phe13,Nle14]Bn(6-14). Control and 1 μM [DTyr6, βAla11,Phe13,Nle14]Bn(6-14)-stimulated values for hGRPR were 3654 ± 560 and 16320 ± 4365 dpm, respectively; for hNMBR 2608 ± 450 and 80862 ± 4450 dpm, respectively; and for hBRS-3 1163 ± 230 and 5079 ±276 dpm, respectively. Results are the mean ± SEM from at least four experiments, and in each experiment the data points were determined in duplicate. Numbers refer to the peptide number in Table 1. Abbreviations: See Table 1 legend.

