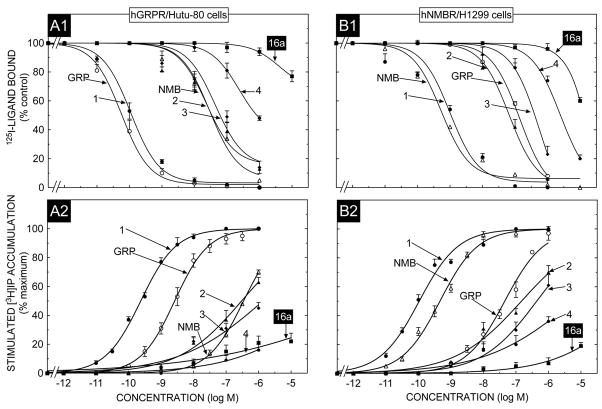
Fig. 3.
The ability [DTyr6, βAla11,Phe13,Nle14]Bn(6-14) (Peptide # 1) and the putative BRS-3 selective agonist peptide #16a, to inhibit binding and to stimulate an increase in [3H]IP formation HuTu-80 cancer cells which natively express hGRPR or H1299 lung cancer cells in which hNMBR is over-expressed. In binding (top panel) HuTu-80 cancer cells (1.0 × 10⁶ cell/ml), or hNMBR/H1299 lung cancer cells (0.4 × 10⁶ cells/ml) cells were incubated for 60 min at 22°C with 50 pM I125- [DTyr6, βAla11,Phe13,Nle14]Bn(6-14), with or without the indicated concentrations of the various peptides added. Results are expressed as the percentage of saturable binding without unlabeled peptide added (percent control). Bottom panel, HuTu-80 cancer cells or hNMBR/H1299 lung cancer cells were subcultured and preincubated for 24 h at 37°C with 3 uCi/ml myo-[2-3H]inositol. The cells were then incubated with the ligands at the concentrations indicated for 60 min at 37°C. Values expressed are a percentage of total [3H]IP release stimulated by 1 μM [DTyr6, βAla11,Phe13,Nle14]Bn(6-14). Control and 1 μM [DTyr6, βAla11,Phe13,Nle14]Bn(6-14)-stimulated values for HuTu-80 cancer cells were 1195 ± 122 and 5150 ± 530 dpm, respectively and for hNMBR/H1299 cells. 1950 ± 82 and 20270 ± 2320 dpm, respectively. Results are the mean ± SEM from at least four experiments, and in each experiment the data points were determined in duplicate. Numbers refer to the peptide number in Table 1. Abbreviations: See Table 1 legend..

