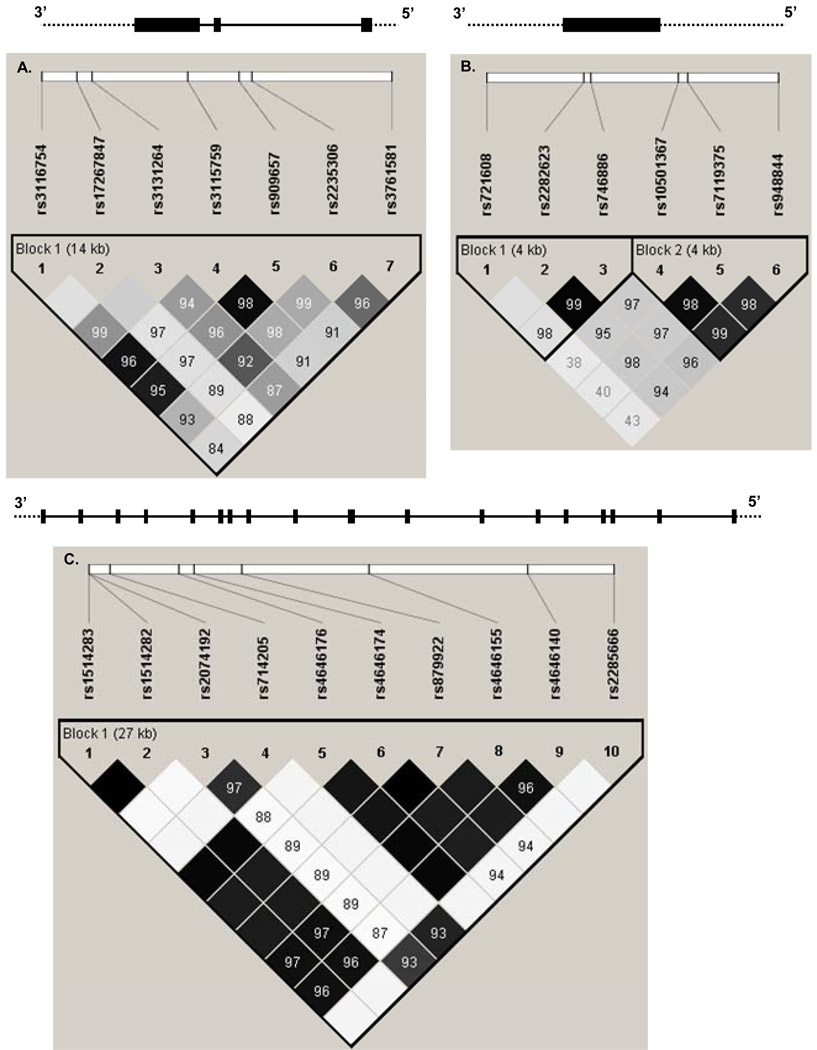
Figure 1.
The gene structures of APLN (A), APLNR (B), and ACE2 (C) and the position of single nucleotide polymorphisms. The black boxes in each gene are exons. Solid lines show introns and dashed lines show flanking regions. Pairwise linkage disequilibrium (LD) coefficients D’×100 are shown in each cell (D’ values of 1.0 are not shown). The r2 color scheme of Haploview was applied (r2 =0 shown in white, 0 < r2 <1 shown in shades of grey, and r2 =1 shown in black).

