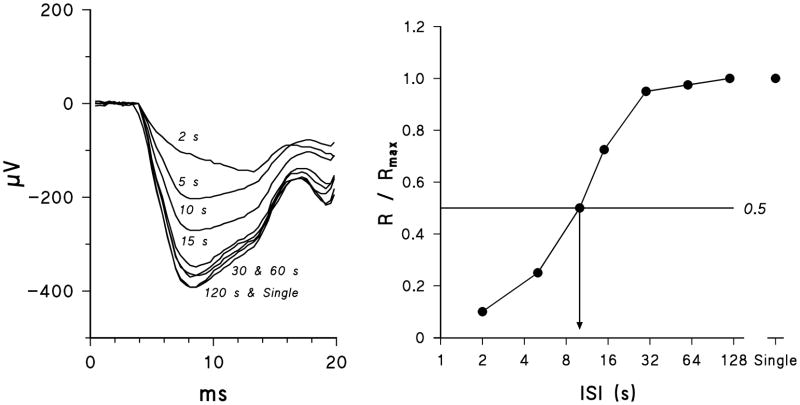
Fig. 1.
Sample results from a 14 year old subject with a history of mild ROP and t50 value (10 s) close to the ROP median. Rod isolated ERG a-wave responses are shown in the left panel; the responses to the single flash and to the probe flash at the indicated inter-stimulus intervals (ISI) are shown. In the right panel, a-wave amplitude (R) expressed as a proportion of the response to the single flash (RMAX) is plotted as a function of ISI. The ISI (arrow) that would produce a half maximum response was determined by linear interpolation.

