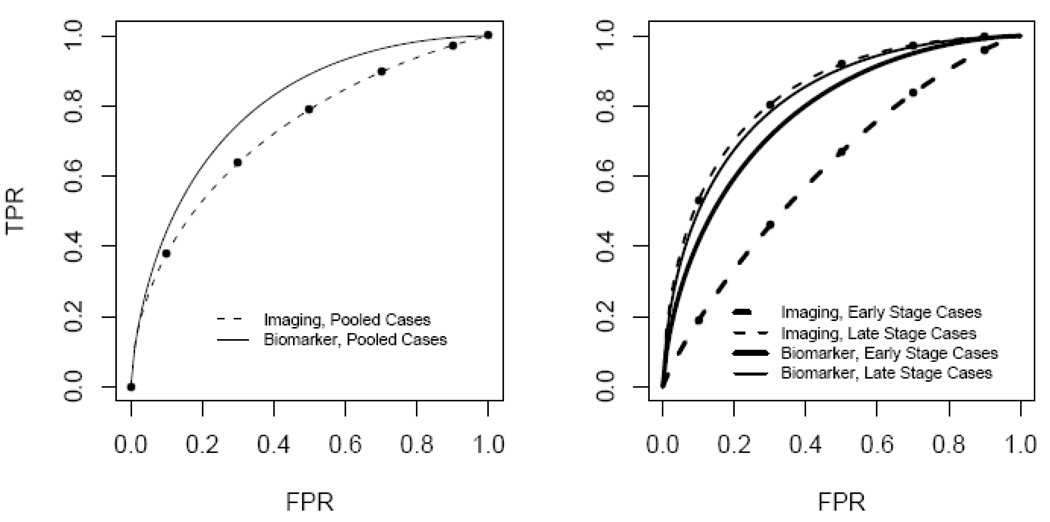
Figure 5.
ROC curves comparing imaging versus biomarker tests for breast cancer. Left panel groups all diseased subjects together for comparison with controls. Right panel separately compares late stage cases and early stage cases with controls. Points displayed on ROC curves for the imaging test correspond to estimated ROC points associated with the image rating categories.

