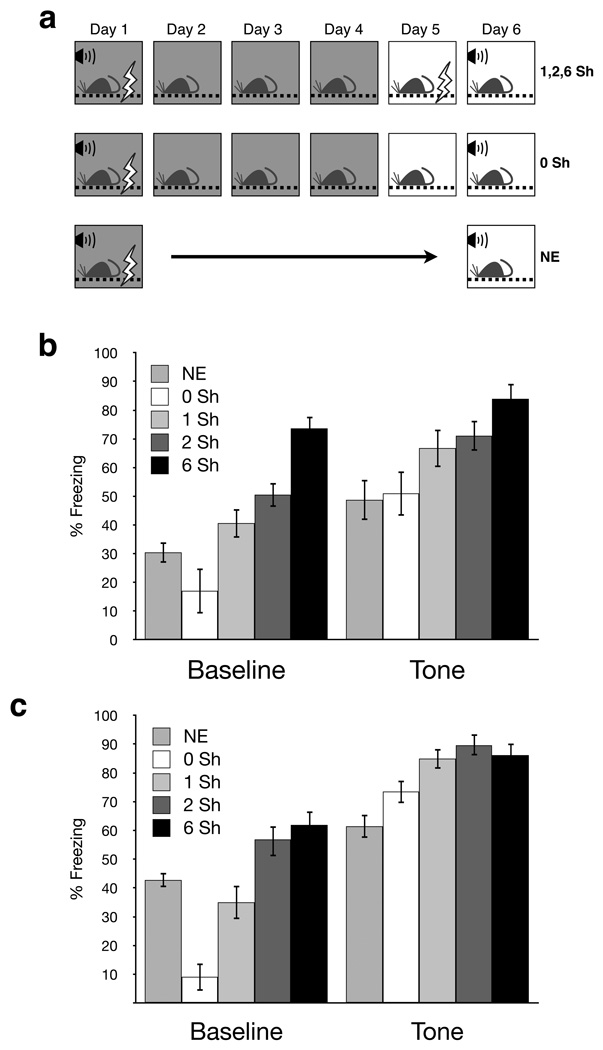
Figure 1.
Percent freezing during the tone test. (a) Experimental design. On Day 1 all animals were trained in Context A (dark boxes) with either 1 (weak) or 3 (strong) tone-shock pairings. Context fear extinction sessions were given in Context A on Days 2–4. No-extinction (NE) groups remained in their homecages for Days 2–5 and were given a tone test on Day 6 with all other groups. All sessions on Day 5 occured in Context B (white boxes), a distinctly different chamber used for the tone test on Day 6, where animals received 1, 2, or 6 unsignaled footshocks (top row, “1, 2, 6 Sh”), were pre-exposed to the context (middle row, “0 Sh”), or were kept in their homecage (bottome row, “NE”). Note that the 0 Sh groups received no aversive foot shocks on Day 5 so these animals were essentially pre-exposed to the testing chamber. (b, c) Percent freezing during the tone test on Day 6. For weak tone conditioning (b), both baseline and tone freezing increased as a function of the number of unsignaled footshocks in the 0, 1, 2, and 6Sh groups. Note that compared to the 0 Sh group, the NE group had higher baseline freezing but equivalent tone freezing. For strong tone conditioning (c), again both baseline and tone freezing increased as a function of the number of unsignaled footshocks given. Note that the NE group had significantly higher baseline freezing and lower tone freezing than the 0Sh group.

