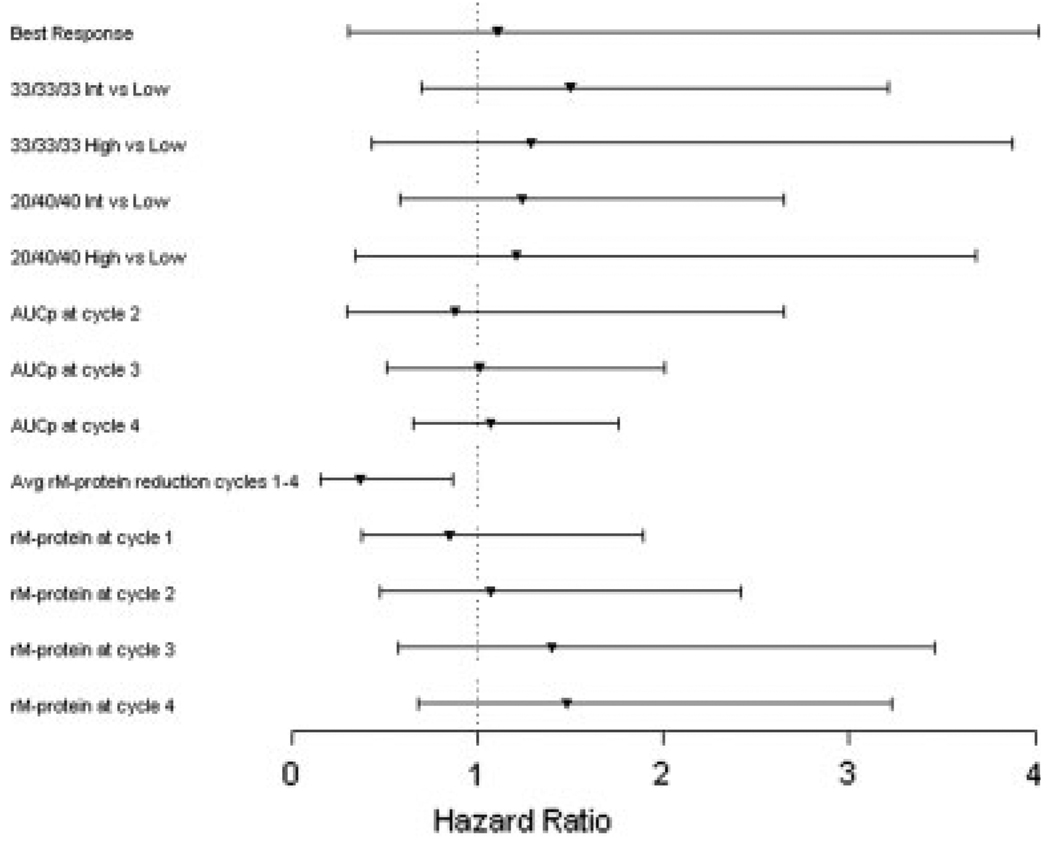
Figure 2.
A forest plot is shown of estimated hazard ratios and 95% Wald confidence intervals for each metric residual monoclonal protein (rM-protein), which is the percentage of serum monoclonal protein remaining relative to the baseline level. Int indicates intermediate; AUCp, area under the rM-protein curve from baseline to a particular cycle; Avg, average.

