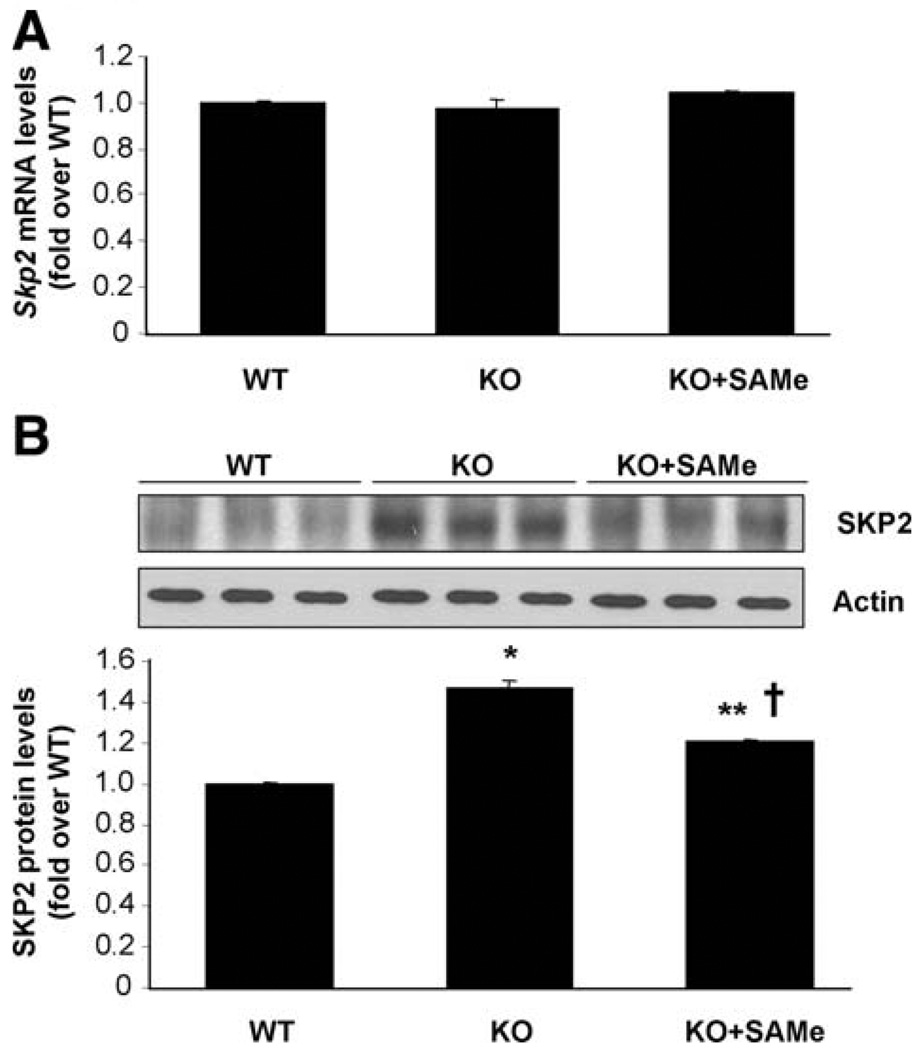
Fig. 6.
Effects of SAM treatment on SKP2 expression in Mat1a KO mice. (A) Real-time PCR analysis of Skp2 mRNA levels. Results are expressed as fold of age-matched WT mice (mean ± SEM) from three to four mice in each group. (B) SKP2 protein levels measured by way of western blot analysis. Results are expressed as fold of the data from age-matched WT mice (mean ± SEM) from three WT, four untreated, and four SAM-treated KO mice. *P < 0.001 versus WT; **P < 0.03 versus WT; †P < 0.02 versus KO.

