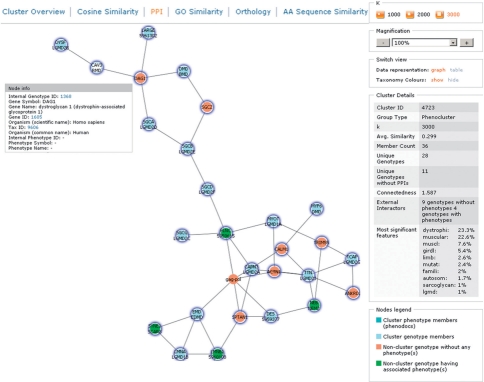
Fig. 2.
Phenocluster of the rippling muscle disease (RMD) phenotype associated to caveolin 3 (CAV3) visualized with k = 3000 for an optimal view. The cluster was found searching for ‘rippling muscle disease’ in phenotype descriptions. Genes associated to phenotypes from the cluster connected by protein interactions are shown (blue nodes). Connected genes with phenotypes that are not within the cluster (green nodes) and genes with no phenotypes associated (red nodes) are also shown. The ‘actions and information’ pane on the right provides statistics, a legend and enables altering the view. The top section enables changing the presentation of similarity scores.

