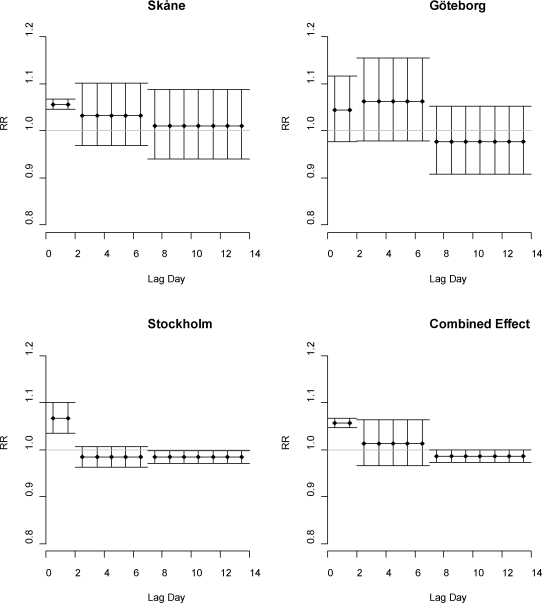
Figure 2.
The distributed lagged relative risks of temperature per °C increase of lag strata temperature above 90th percentile (lag 0–1) with 95% confidence bounds as vertical lines. The x-axis corresponds to lag day, and the y-axis to the relative impact on mortality (65+ of ages). The horizontal line marks relative risk =1.

